November 4, 2017
Introduction
An ADCP can be powered by external power or powered by an internal battery. The ADCP can record internally or record to a PC and the data can be viewed live. The ADCP data can be viewed with the software Pulse.
Connections
Underwater Connector
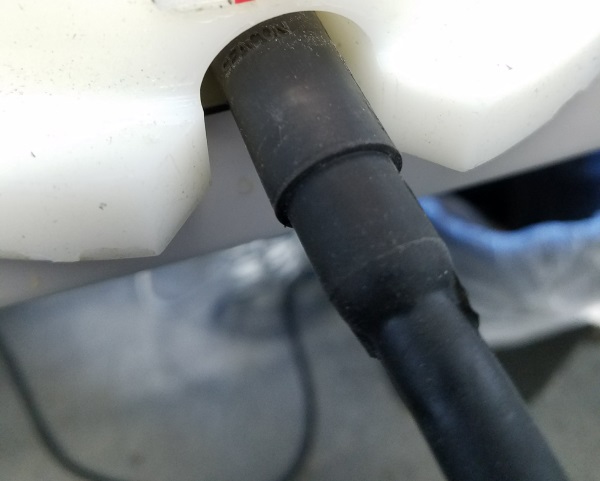
Connect the underwater connect to the ADCP. Verify the orientation of the rubber connector onto the pins. Then rotate the locking sleeve on the connector to lock the underwater connector to the ADCP. Make sure the underwater connector is plugged in the correct orientation or it can damage the ADCP.
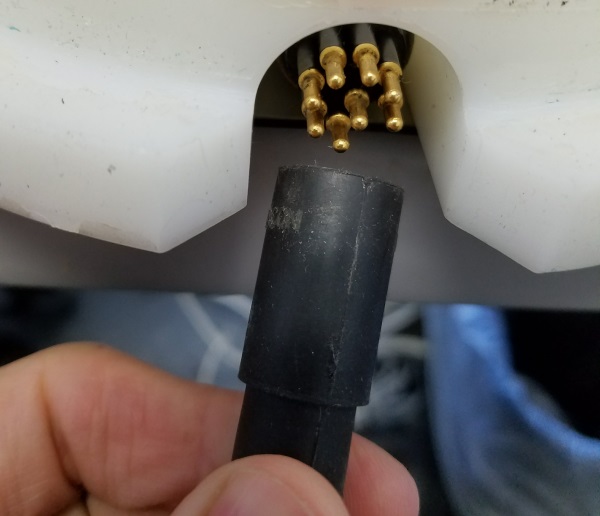 Underwater Connector Pins |
 Plug Connector |
|---|---|
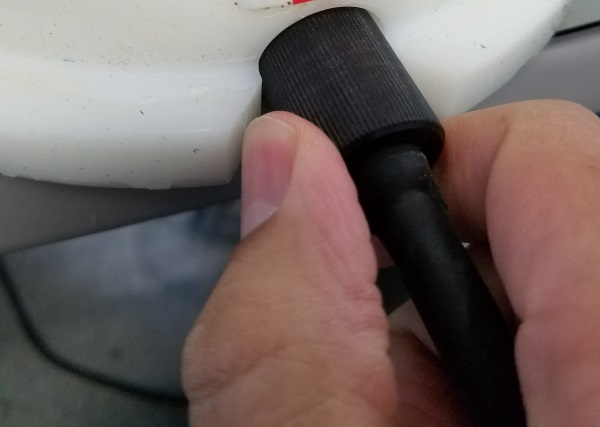 Thread Connector |
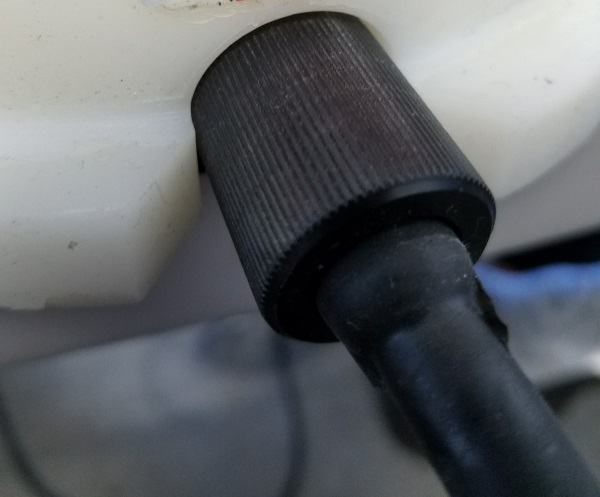 Connected |
Communication and Power Connection
The typical Underwater cable will have 3 connections. RS-485, RS-232 and Power. The RS-485 connector is the green 5 pin connector. The RS-232 connector is the DB-9 connector. The Power connector is the 2 pin molex connector. Included with the ADCP are USB to RS-485 and USB to RS-232 adapters.
You may need to install the drivers for the USB adapters.
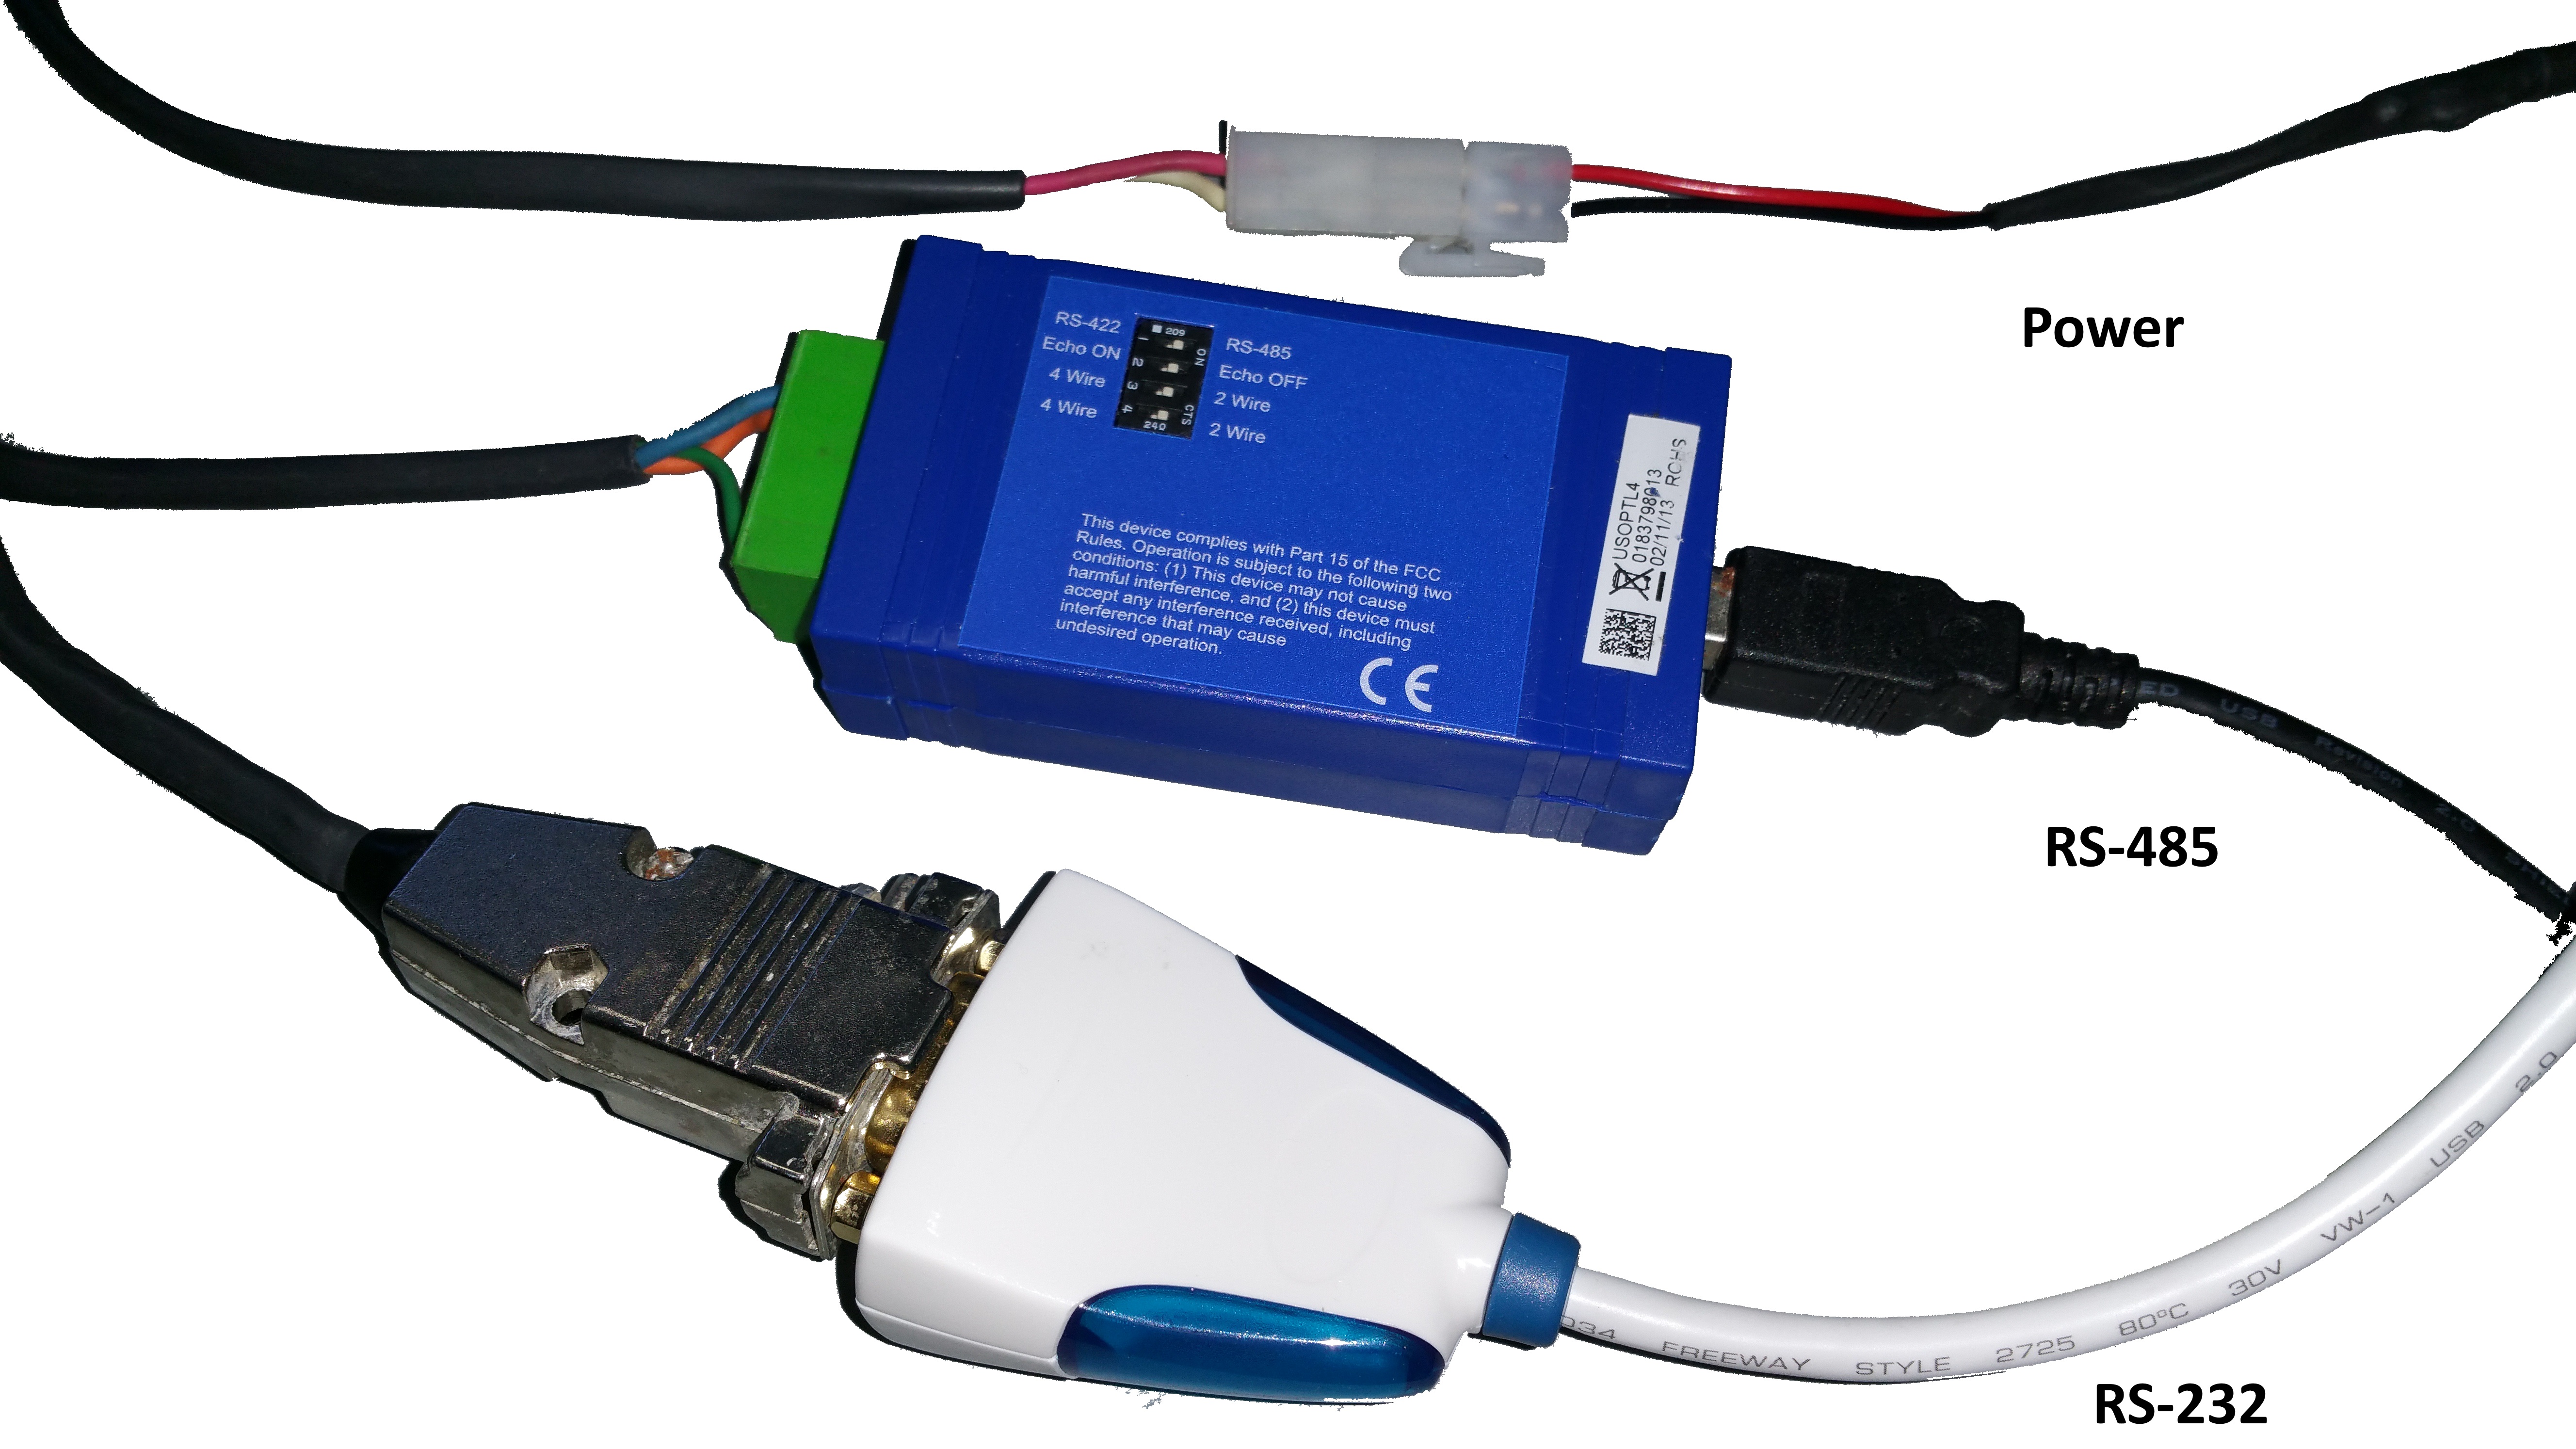
Communication and Power Connectors
Power
The ADCP includes a power brick. This power brick will connect to the wall outlet. The power brick will output 36 volts. This power brick will connect to the ADCP underwater connector. The ADCP can handle between 12v and 36v.
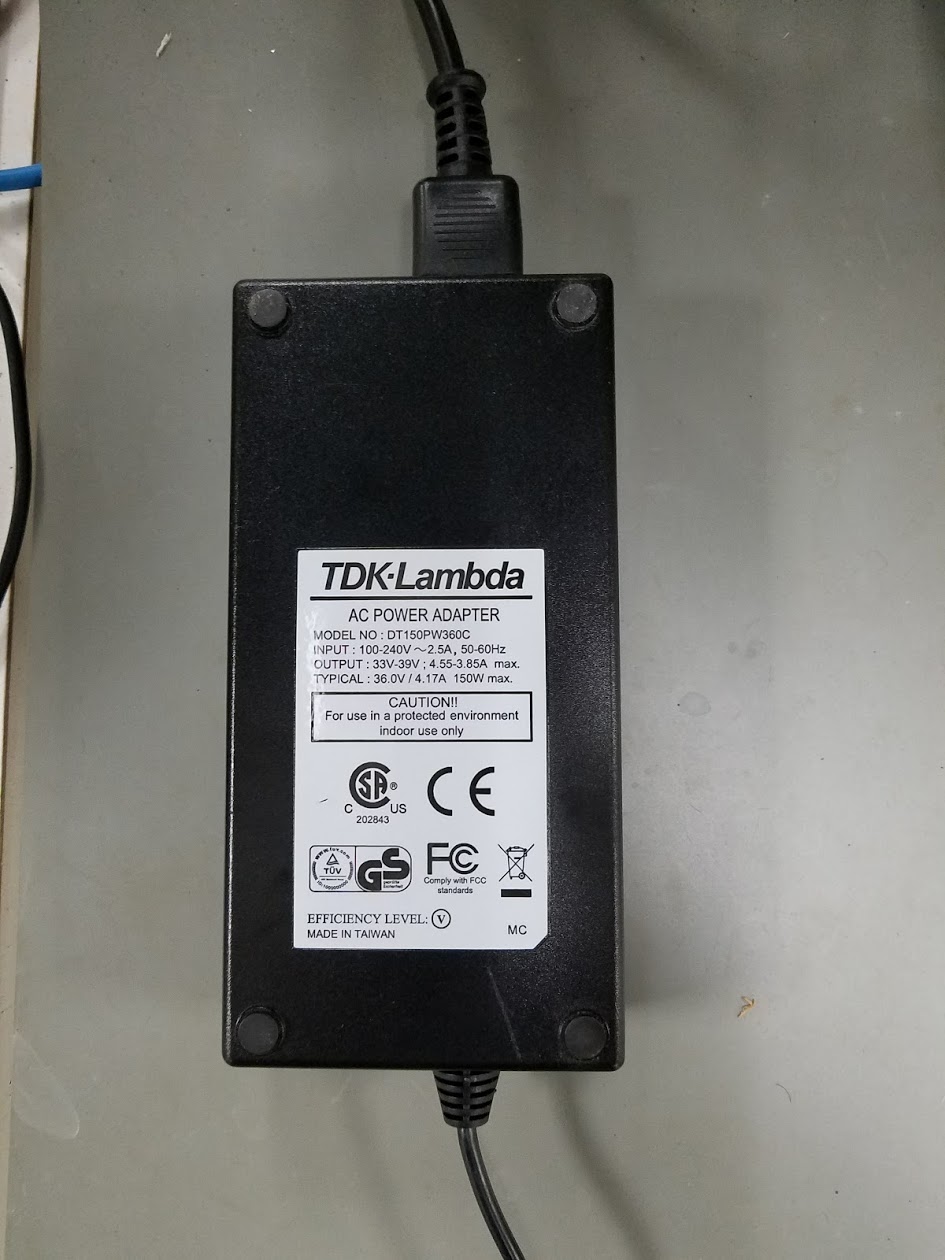
Power Brick
Pulse Software
Install the Pulse software. This application will allow you to communicate with the ADCP. It will view live ADCP data. It will record ADCP data. It will playback ADCP data. It will download any data recorded on the ADCP. It will update the firmware. It can be used to screen and reprocess the data.
Serial Terminal
Open the Pulse software. In the top right corner click on the terminal icon.
Within the terminal, click the SCAN button to load any serial ports available. The default baud rate for the ADCP is 115200. Then click the BREAK. This will wakeup the ADCP and output the BREAK statement.
Copyright (c) 2009-2017 Rowe Technologies Inc. All rights reserved.
Direct Reading
DP600
SN: 01300000000808000000000000000453
FW: 00.02.114 Nov 21 2017 11:41:40
If you do not get any output after clicking the BREAK button, verify your connection and power.
If the output cannot be read and looks like random characters, make sure your baudrate is correct. The default baudrate is `115200.
Start Pinging
To begin collecting data, click the START PING button. This will set the time, based off the computer’s time. It will then set the START command which will tell the ADCP to start collecting data.
View Data
Now that data is being output by the ADCP, lets view the data. Click the VIEW button in the top navigation bar. This will take us to the different views available to view the ADCP data.
Graphical
The main purpose of this view is to get an overall view of the ADCP. You can see both the Water Profile data (water currents) and the Bottom Track data (speed of the boat and depth of the water).
The graphical view will be mainly plots. This will show the Heatmap plot to display data for each bin and give a history.. The Profile plots will be a line graph of each bin. The TimeSeries plot will give a history. Any plot can be changed by clicking on the gear in the top left corner of any plot. There are numerous options to select for a plot, like the plot type, the min and max and coloring. You can add and remove lines.
Tabular
The main purpose of this view is to view the raw values for each bin. The user can select which cooridnate transform the data will be in BEAM (B0, B1, B2, B3), Instrument (x, y, z), or Earth (east, north, vertical).
The Amplitude data is the signal strength for each bin. The Correlation is a quality indicator for each bin. Anything above 25% is considered good data.
### DVL
The main purpose of this view is to display the ```Bottom Track``` data.  Typically a ```DVL``` will only output ```Bottom Track``` data.  This will give the speed of the boat and the depth of the water.  This is used for navigation.
Bottom Track StatusandStatusare two seperate values.Statusgives an overall health of the ADCP.Bottom Track Statuson top of giving the health of the ADCP also gives the status of the Bottom Track search algorithm. The ADCP has to find the bottom. There are steps involved with finding the bottom. TheBottom Track Status``` will give the step the ADCP is currently in to find the bottom. More information on the search algorithm can be found here.
If there is GPS data availabe, it will also display the GPS data.
If Water Track is used, it will also give the values for Water Track. Water Track is a backup source for Bottom Track. More information can be found here about how to setup Water Track.
Diagnostics
The main purpose of this view is give you an overall health of the data. It will tell you what data is available and what the settings are.
Backscatter
The main purpose of this view is give you a large Heatmap plot.
Record Data
To begin recording data, press the large white button in the top navigation bar RECORD. This will start recording a file to the directory:
C:\RTI_Capture
The file name will be the date and time and the serial number of the ADCP.
More topics and tutorials can be found at Rowe EDU
For more information about Rowe Technologies ADCPs, please visit:
http://rowetechinc.com/seaprofiler/
sales@rowetechinc.com
+1 (858) 842 3020.