June 2, 2020
Introduction
A water profile measurement is a profile of a water column that gives the direction and speed of the water currents.
Water Profile Description
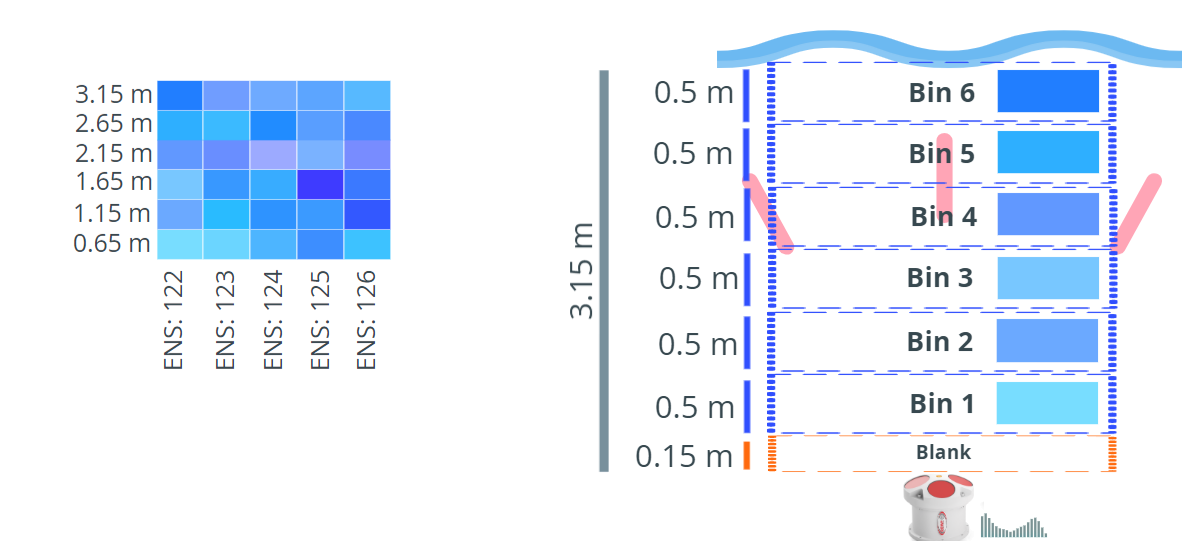
Bins
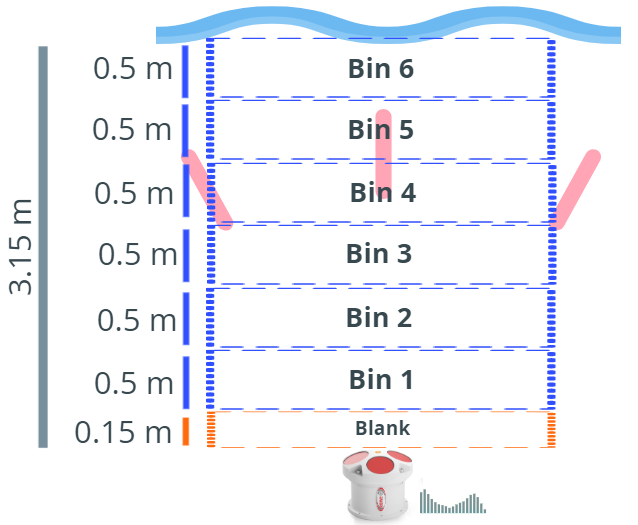
So to create a water profile measurement, the water column must be broken up into bins (cells). The bin sizes and number of bins are set by the user using the CWPBS command and CWPBN commands.
Blank
The Blank area is the area before the first bin to ignore. This size of this area is set by the user using the CWPBL command. There are number of reason to set a specific blank size. If you want the first measurement to start at specific depth, you can use the blank size to move the first bin to this location. If you know the area near the first bin is bad data because of structures, you can ignore this area.
The customer want the minimum blanking area. Due to physics, this Blank can never be 0 meters. But you set the command CWPBL to zero, and based on the settings, the minimum blanking area will be used. To get the smallest blanking area, you want to set the smallest profiling range to ensure the ping timing is as short as posible.
Profiling Range
There are two maximum profiling ranges. There is the configured maximum profile range and the maximum profile range the ADCP frequency can achieve.
The maximum configured profile range is:
Maximum Configured Profile Range = (BLANK) + (BinSize * NumBins)
Example
Blank Area     [CWPBL] = 0.15m
Bin Size       [CWPBS] = 0.5m
Number of Bins [CWPBN] = 6
Max Configured Range = 0.15m + (0.5m * 6) = 3.15m
In this example, the maximum range we will measure is 3.15m. The first measurement will begin at 0.15m. The profile range is 3m.
Water Profile Measurement
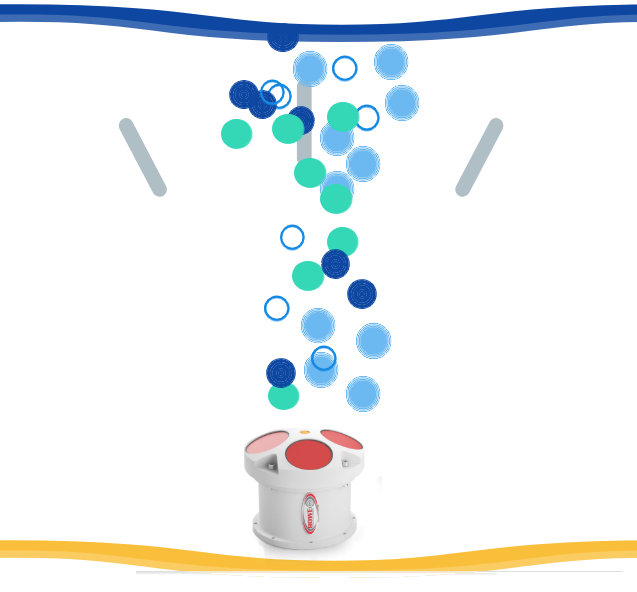
Within the water column, the ADCP is actually measuring the small particales and debris moving in the water. The assumption is those particles are not swmimming, but are actually drifting with the water current. You need some particiles in the water to get a good measurement. If there is very high sedmient, certain ADCP frequencies will have difficulties looking through the sediment. If there is little to no sediment, there will be nothing for the ADCP ping to bounce off and return a value. So when you select a frequency for you ADCP, it is important you take into account your water type.
Water Profile Data
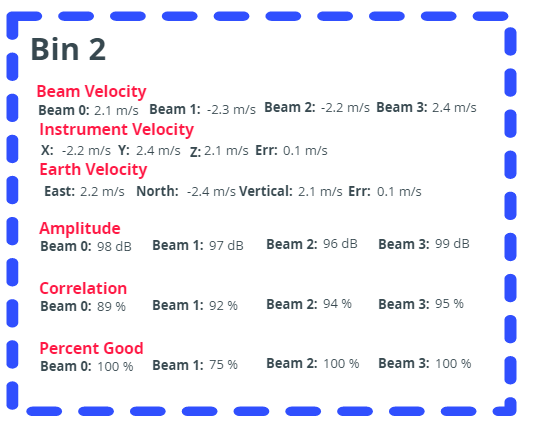
The Water Profile data includes the water velocities, amplitude, correlation and percent good. Each bin contains all this data. So there is a lot of data involved with a water profile measurement.
Water Velocities
The water velocities typically is in one of four coordindate transforms. Beam, Instrument, Ship or Earth.
Beam Velocity
Beam Velocity is the raw velocity data. This data states what speed each beam measured for each bin. The value will be a positive or negative value. If the value is positive, the water is moving towards that beam. If the value is negative, the water is moving away from that beam.
In the example above, the water is moving towards Beam 0 and 3 and away from Beams 1 and 2.
Instrument Velocity
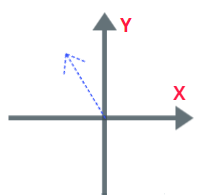
Because we have 3 or more beams, we can transform the raw Beam Velocity to X, Y, Z, and Error. This allows us to plot the data in 3 dimensional space and create a vector for each bin.
In the example above the water is moving negative X and postive Y with a small vertical velocity.
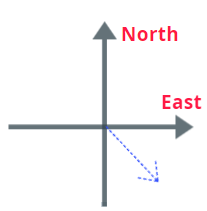
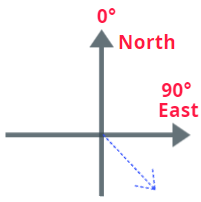
Earth Velocity
Data in X, Y, Z is helpful, but if you want to plot the data on map, you need to know where North relates to your coordinate system. Earth utilizes the internal compass to store the data as East, North and Vertical. Now you can plot the data on a map and know the proper orientation of the water currents.
In the exampl above, the water is moving SouthEast.
Velocity Vector
Now we have the Instrument and Earth data, how do we create a vector from this data.
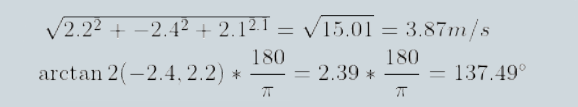
Magnitude

Direction
So from our example above, we can convert the Earth velocities into a velocity vector. The water is moving at 3.87 m/s and at a direction of 137.49°. This velocity is only for bin 2. Each bin will have its own velocity vector.
Plot the Data
So then you calculate all the velocity vectors for each bin the water profile measurement. You can create a color bar to represent the velocities and you can plot water velocity for the water profile measurement as a heatmap. Each ensemble will contain the velocity data for each bin. Stack all the ensembles together to get an overall picture of all the entire deployment.
Conclusion
Hopefully this helps you understand what a Water Profile is and the data. You should be able to create you own Water Profile plots from this information in any platform. We have plenty of source code available on our Github page to help you create plots in many different programming languages including C, C++, C#, MATLAB and Python.
If you have any any questions about this or any other topics, I will be available on weekdays at 11AM PST and 11PM PST on a Discord channel created to answer any questions about your ADCP or DVL. Stop by, hang out and ask a question. Ask a question about any ADCP from any manufacture. The concepts are all the same. Click the Discord button below to join the chat. Or you can always email me.
More topics and tutorials can be found at Rowe EDU
For more information about Rowe Technologies ADCPs, please visit:
http://rowetechinc.com/seaprofiler/
sales@rowetechinc.com
+1 (858) 842 3020.